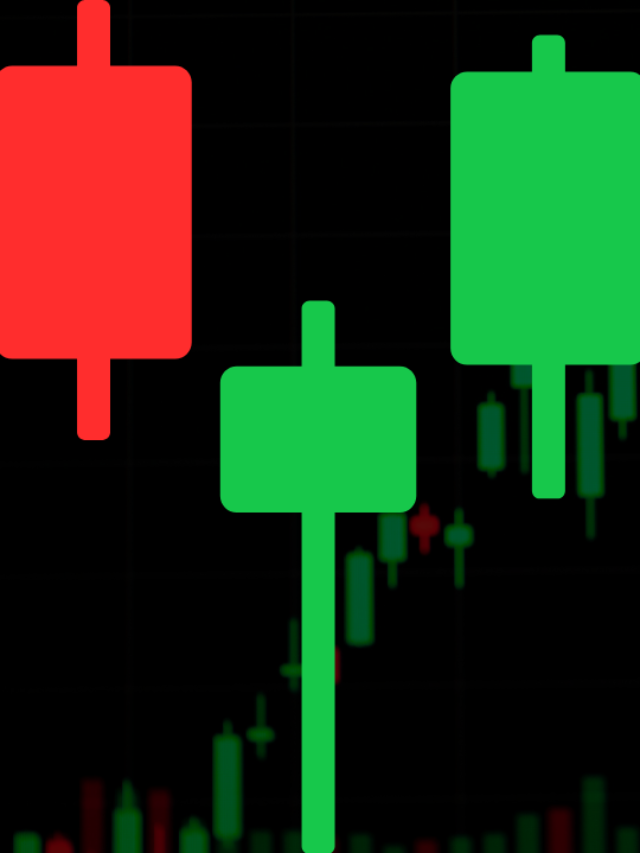
The hammer is a candlestick chart pattern that forms when a security trades significantly below its opening price, but recovers to close near the opening price during the same period. This pattern forms a hammer-shaped candlestick, characterized by a lower shadow that is at least twice the size of the candlestick’s real body. The real body represents the difference between the opening and closing prices, while the shadows represent the highest and lowest prices during the period. The hammer candlestick pattern is typically a reversal indicator, often seen after a downtrend, suggesting that a potential reversal may be underway. It shows that sellers were in control for some portion of the session, but failed to hold the price at its lows, allowing buyers to push it back up.
Understanding the Hammer Candlestick
A hammer candlestick typically forms after a decline in the security’s price, which signals that the market is attempting to establish a bottom. The hammer pattern suggests a possible capitulation by sellers, followed by a price correction that signals a possible reversal in price direction. This entire process occurs in a single period, where the price drops significantly after the open, but rebounds to close near the open. A hammer candlestick resembles the shape of a “T,” which indicates the possibility of this pattern. However, it does not confirm an upward price reversal until a confirmation candle occurs. Confirmation occurs when the candle immediately following the hammer closes above the hammer’s closing price, ideally demonstrating strong buying activity. Candlestick traders often use confirmation candles to take long positions or exit short positions. For new long trades, the stop loss is typically set below the shadow of the hammer. While hammers are valuable indicators, they are rarely used in isolation. Traders usually combine them with price action, trend analysis or technical indicators for further confirmation. Hammer candlesticks can be seen on all time frames, including one-minute, daily and weekly charts.
Difference between Hammer Candlestick and Doji
The doji is another candlestick pattern with a small real body. Unlike the hammer, the doji signifies indecision and has both upper and lower shadows. Depending on the confirmation that follows, the doji can signal either a price reversal or a continuation of the current trend. On the other hand, the hammer is formed exclusively after a price decline, signals a potential upside reversal (if confirmed), and has only a long lower shadow.
Limitations of Using Hammer Candlesticks
There is no guarantee that the price will continue to rise after the confirmation candle. A hammer with a long shadow and strong confirmation candle may move the price significantly higher within two periods, which may make it a less favorable entry point due to the increased distance for stop-loss placement. This distance may expose the trader to risks that may exceed the potential reward. Furthermore, hammer patterns do not provide price targets, making it challenging to determine the reward potential of a trade. Exits must rely on other candlestick patterns or additional forms of technical analysis.
Psychology of the Hammer
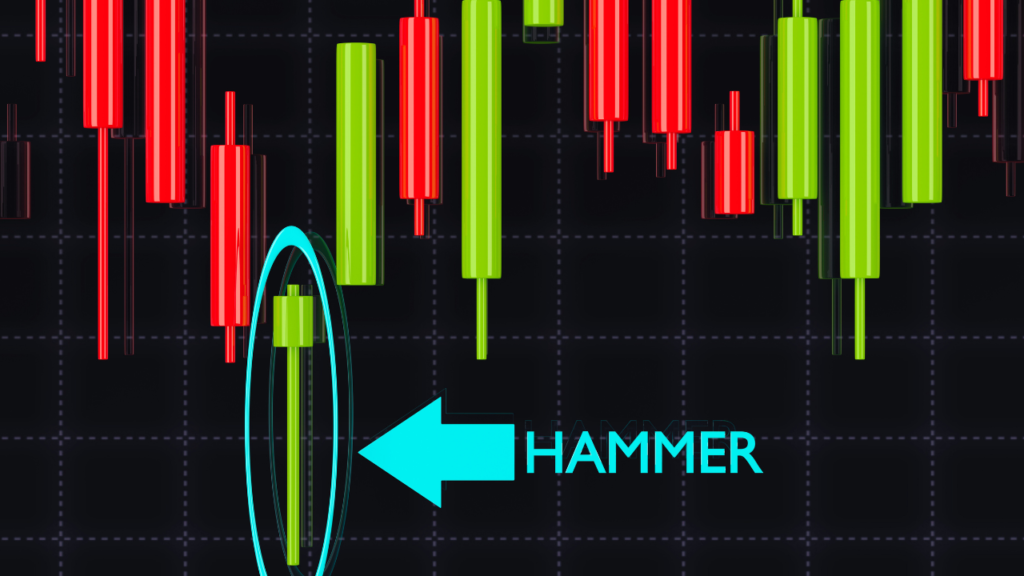
As we have seen, an actionable hammer pattern typically emerges in the context of a downtrend, or when the chart is showing a sequence of lower highs and lower lows. The appearance of the hammer indicates that more bullish investors are taking positions in the stock and a reversal in downward price movement may be imminent.
The long lower shadow on the hammer candlestick indicates price’s attempt to continue its downward trajectory, but the higher close represented by the real body indicates that sellers ultimately failed to keep price above its intraday low. Price’s climb from the session low to the higher close indicates that the more bullish outlook won the day, setting the stage for a potential reversal to the upside.
Practical Application
If you’ve spotted a hammer candlestick on a price chart, you may be eager to make a trade and profit from the potential upcoming price movement. Before you place your order, let’s take a look at a few practical considerations that can help you make the most of a trade based on the hammer pattern.
The Hammer Signal
The first step is to ensure that what you’re seeing on the candlestick chart does in fact correspond with a hammer pattern. If you’re looking for hammer signal that implies a potential upside reversal, it should occur in the context of a downtrend, or declining price action marked by a series of lower highs and lower lows. Under these circumstances, the signal you’re keeping an eye out for is a hammer-shaped candlestick with a lower shadow that is at least twice the size of the real body. The closing price may be slightly above or below the opening price, although the close should be near the open, meaning that the candlestick’s real body remains small.
Looking for Confirmation
Confirmation of a hammer signal occurs when subsequent price action corroborates the expectation of a trend reversal. In other words, the candlestick following the hammer signal should confirm the upward price move. Traders who are hoping to profit from a hammer signal often buy during the formation of this upward confirmation candle.
Placing Stops and Taking Profits
As with any trade, it is advisable to use stops to protect your position in case the hammer signal does not play out in the way that you expect. The level at which you set your stop will depend on your confidence in the trade and your risk tolerance. However, it may be useful to set a stop loss below the low of the hammer pattern, providing protection in case the downward pressure reemerges and the upward move that you were anticipating never materializes.
On the other hand, if the price does begin to rise, rewarding your recognition of the hammer signal, you will have to decide on an optimal level to exit the trade and take your profits. On its own, the hammer signal provides little guidance as to where you should set your take-profit order. As you strategize on a potential exit point, you may want to look for other resistance level such as nearby swings lows.
FAQs
What is a Hammer Candlestick?
A hammer candlestick is a technical chart pattern that resembles a “T” where the price falls significantly below its opening time, forms a long lower shadow, and then closes close to its opening time. This pattern forms after a downtrend and is often interpreted as a signal of a potential reversal. An inverted hammer candlestick pattern resembles a hammer but has a smaller real body below and a longer upper shadow. This pattern occurs after a downtrend and may signal a potential reversal to the upside if confirmed by subsequent price action.
Is the hammer candlestick pattern bullish?
Yes, the hammer is considered a bullish pattern, indicating that the stock has reached its bottom and may move upwards. It signifies a shift in control from sellers to buyers during the trading period. However, the pattern is confirmed when the next candle closes above the closing price of the hammer. The reverse hammer candlestick pattern looks similar to an inverted hammer, but usually forms at the bottom of a downtrend. It signals that a potential bullish reversal may occur, in which buyers will regain control.
What is the difference between a hammer candlestick and a shooting star?
While the hammer signifies a bullish reversal after a downtrend, the shooting star signifies a bearish reversal after an uptrend. The shooting star has a long upper shadow, closes near its opening price, and suggests the top of the price trend. The bearish hammer candlestick pattern looks similar to a regular hammer, but it forms during an uptrend and signals potential weakness or reversal in the market. It often suggests that sellers are starting to gain control.
The Bottom Line
The hammer candlestick pattern is a technical indicator that forms when a security trades well below its opening price but reverses to close near the opening price. The pattern’s lower shadow should be at least twice the size of its real body, indicating a shift from sellers to buyers. This setup suggests a potential price reversal to the upside, but traders should use confirmation and additional analysis for better accuracy. The inverted hammer candlestick pattern, like the regular hammer, signals a potential price reversal but occurs at the bottom of a downtrend and has a long upper shadow. If confirmed, it could signal a shift towards bullish momentum.