
Candlestick patterns are one of the most reliable tools for traders to analyze market trends and make informed decisions. These patterns visually reflect market psychology, helping traders identify potential price movements.
What Are Candlestick Patterns?
Candlestick patterns are charting tools used in technical analysis to understand price movements in the financial markets. Each candlestick represents a specific time frame and contains information about the open, close, high, and low prices. By interpreting the shape and color of these candles, traders can identify trends, reversals, and market momentum. Bullish candlestick patterns indicate a potential increase in prices, indicating buying opportunities. Bearish patterns, on the other hand, indicate potential price declines, pointing to selling opportunities.Candlestick patterns reveal stock trends
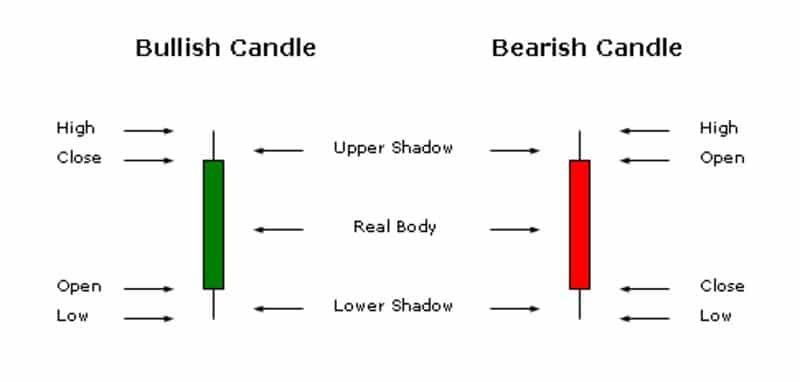
Anatomy of a Candlestick
Before getting into specific patterns, let’s break down the components of a candlestick:
- Body: Shows the range between the open and close prices. Long bodies indicate strong price movement.
- Wicks (or shadows): Show the high and low prices within the time frame. Long wicks can indicate market indecision.
- Colors: Typically, green (or white) indicates bullishness, while red (or black) indicates bearishness.
Anatomy of a Candlestick
Understanding this structure is key to correctly identifying bullish and bearish patterns.
Popular Bullish Candlestick Patterns
Bullish candlestick patterns indicate potential upward price movement, often appearing after a downtrend. Here are some of the most popular:
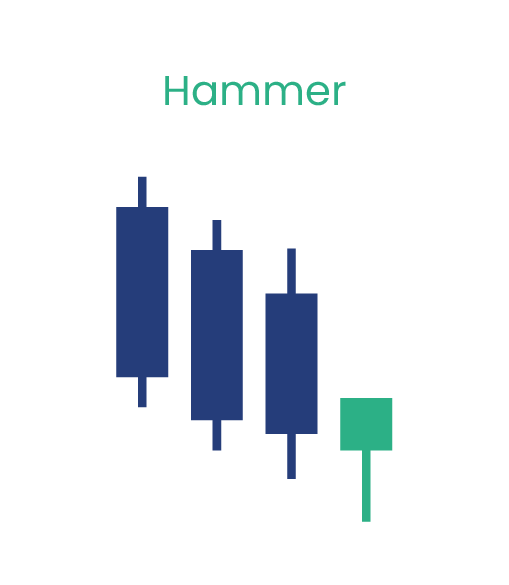
Hammer: A small body with a long lower wick. This signals a potential reversal from a downtrend. The length of the wick reflects buyers rejecting lower prices.
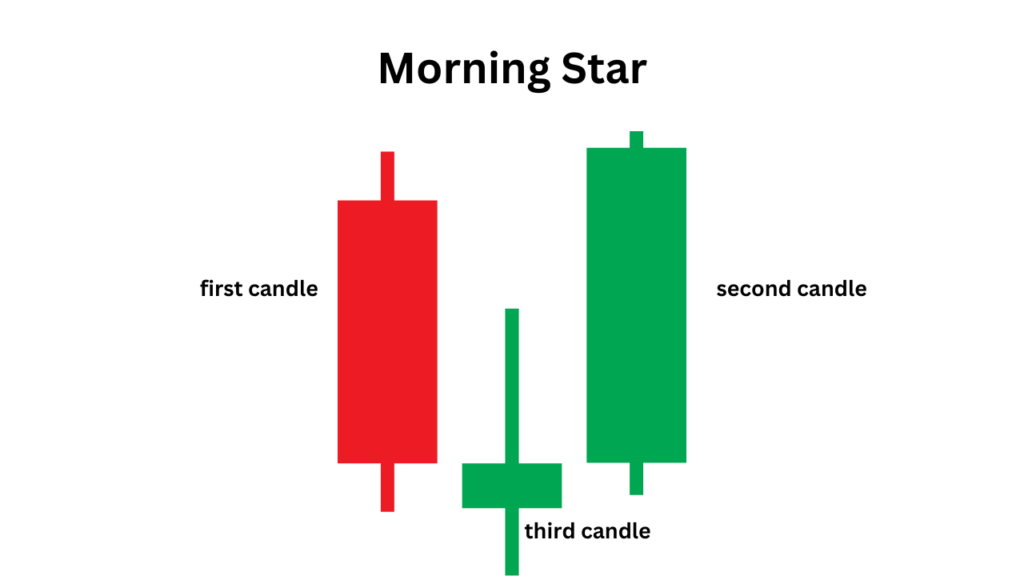
Morning Star: A three-candle pattern that indicates the end of a downtrend and the beginning of an uptrend. It consists of a bearish candle, a small indecisive candle, and a bullish candle.
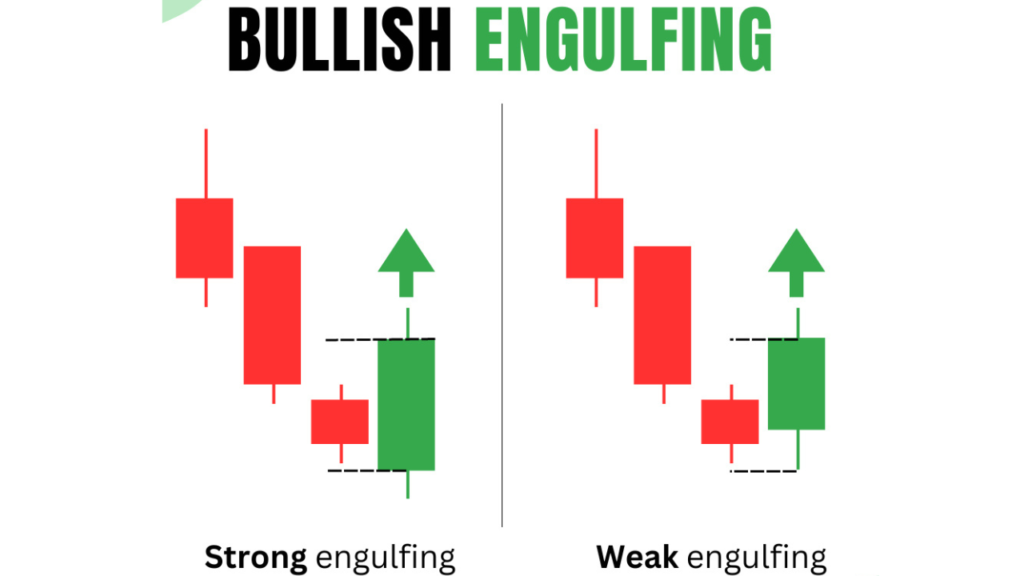
Bullish Engulfing: A large green candle completely engulfs the previous red candle, indicating strong buying pressure. This pattern often appears at the bottom of a downtrend.
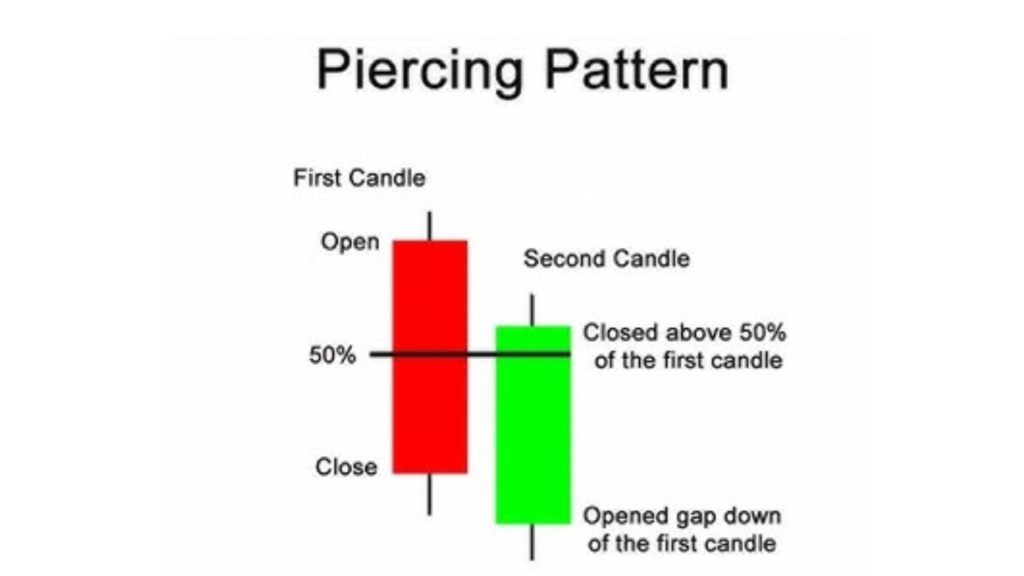
Piercing Line: A green candle opens below the previous red candle’s close and closes above its midpoint. This indicates a strong change in momentum.
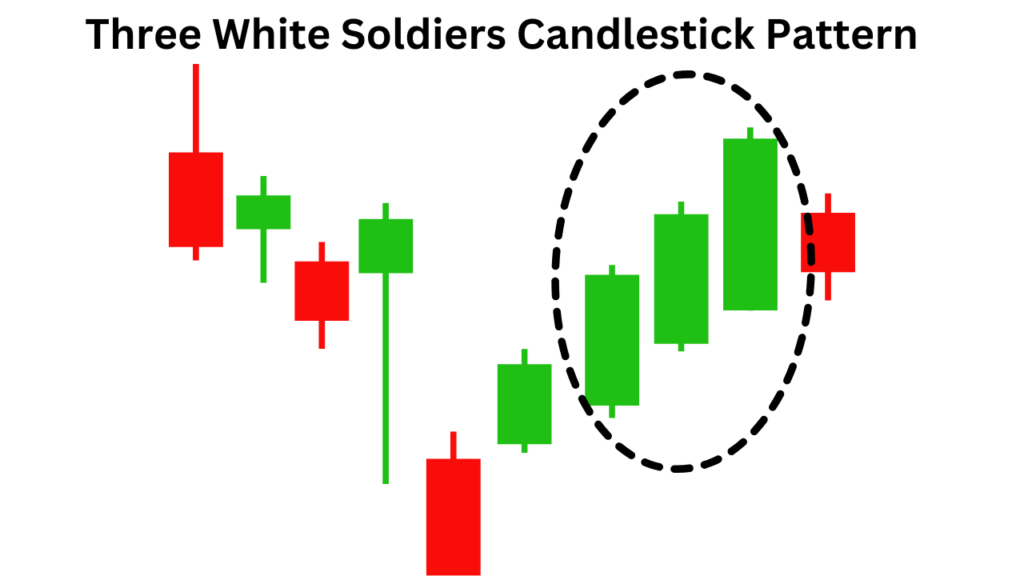
Three White Soldiers: Three consecutive green candles with small wicks indicate strong bullish momentum and buyer confidence.
Popular Bearish Candlestick Patterns
Bearish candlestick patterns suggest potential downward price movement and often follow an uptrend. Common bearish patterns include:
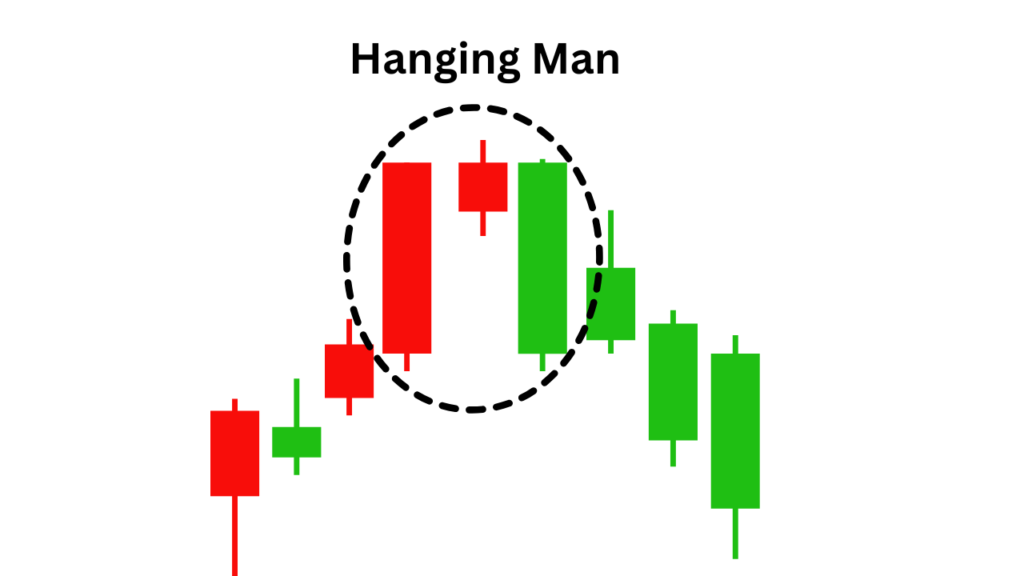
Hanging Man: Resembles a hammer but appears after an uptrend, indicating a reversal. Long lower wicks indicate selling pressure.
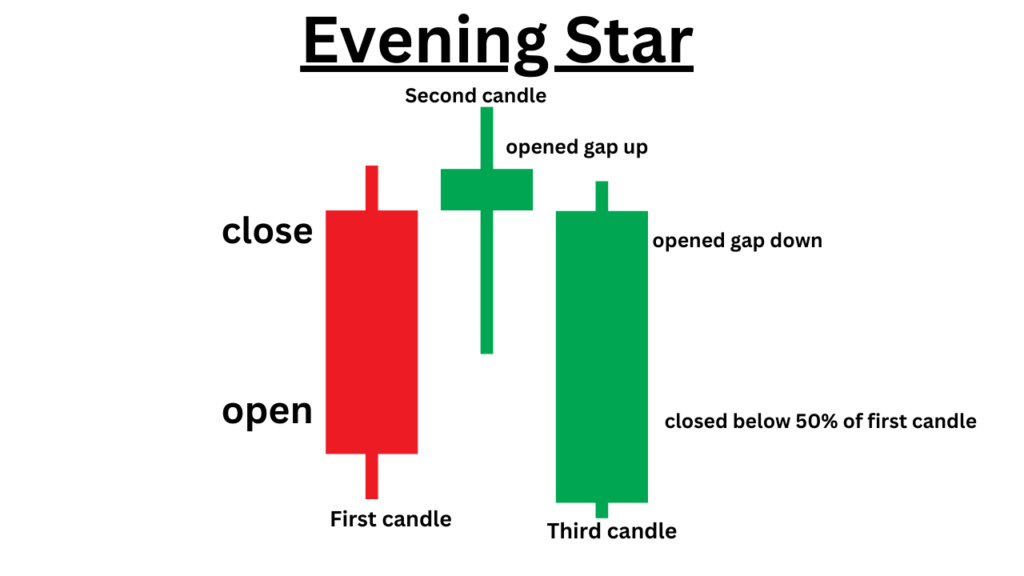
Evening Star: A three-candle pattern that marks the transition from an uptrend to a downtrend. It consists of a bullish candle, a small indecisive candle, and a bearish candle.
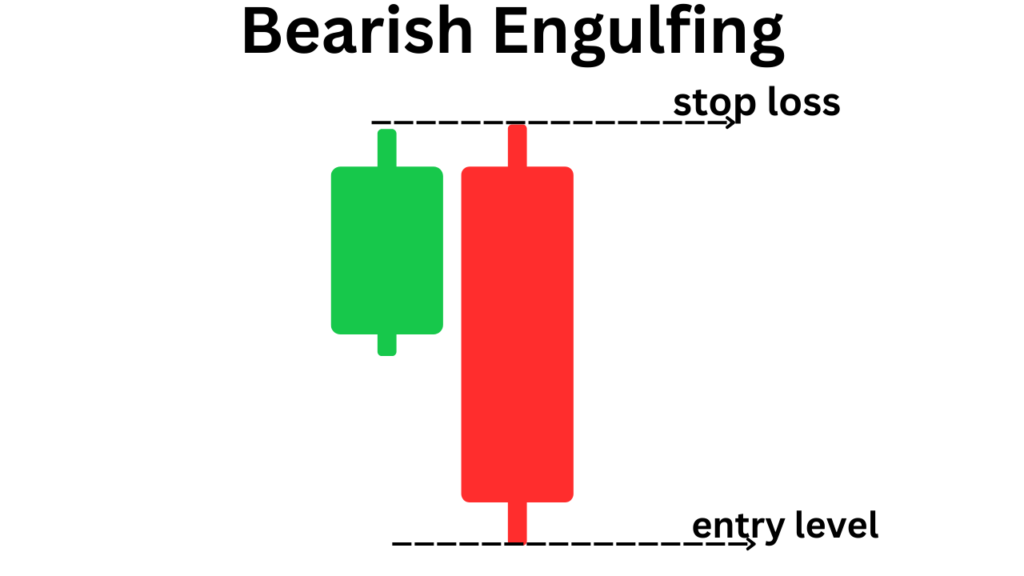
Bearish Engulfing: A large red candle engulfs the previous green candle, indicating strong selling pressure. It is often seen at the peak of an uptrend.
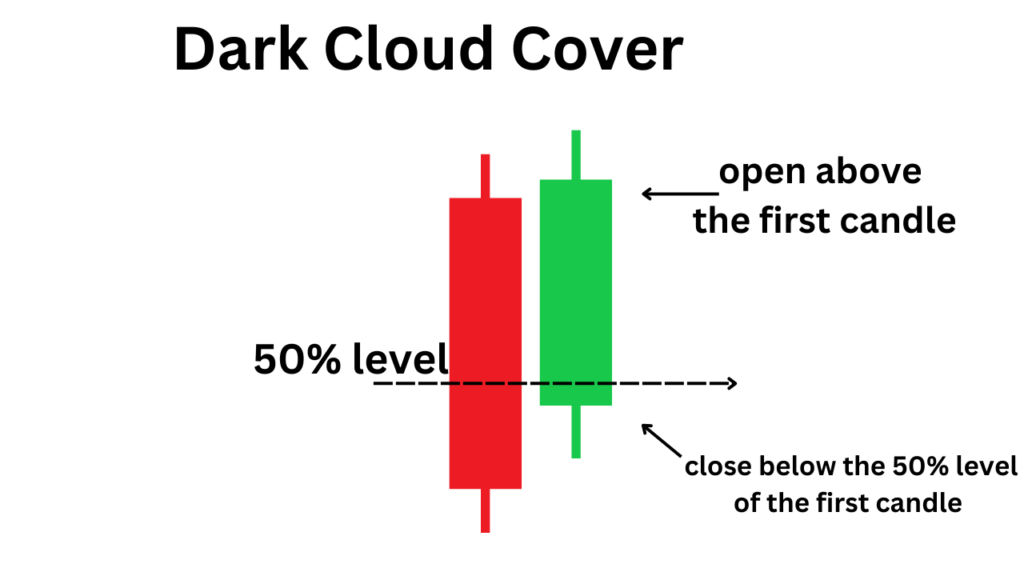
Dark Cloud Cover: A red candle opens above the previous green candle’s close but closes below its midpoint. It signals a bearish reversal.
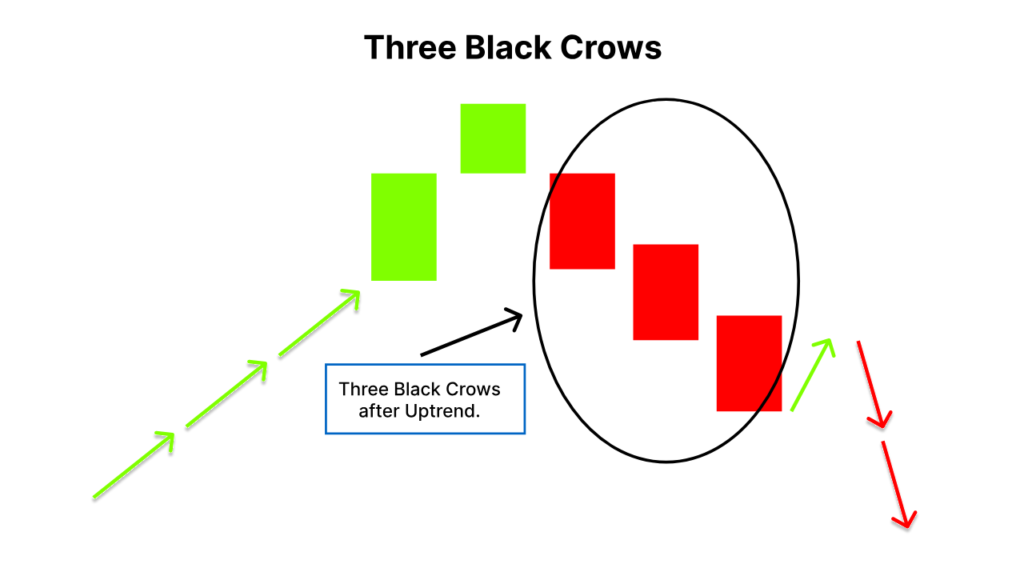
Three Black Crows: Three consecutive red candles with short wicks indicate strong bearish momentum and seller dominance.
Bullish vs. Bearish
| Aspect | Bullish Patterns | Bearish Patterns |
|---|---|---|
| Market Direction | Uptrend (price increase) | Downtrend (price decrease) |
| Trader Action | Buying opportunities | Selling opportunities |
| Common Examples | Hammer, Morning Star, Engulfing | Hanging Man, Evening Star, Engulfing |
Bullish patterns thrive in oversold markets, while bearish patterns dominate in overbought scenarios. Recognizing these differences can help traders make strategic entry and exit decisions.
Current Market Insights and Updates
traders will increasingly use AI and machine learning tools to analyze candlestick patterns in real-time. These tools combine historical data with live market updates to improve forecasting accuracy. For example, platforms such as TradingView and MetaTrader 5 now offer integrated pattern recognition, helping traders make faster decisions. Additionally, cryptocurrency markets have adopted candlestick patterns, as their high volatility makes these patterns more prominent. Traders must adapt to these developments by integrating traditional techniques with modern tools. The rise of decentralized finance (DeFi) has further increased the need for quick pattern analysis in trading pairs.
Common Mistakes When Using Candlestick Patterns
When it comes to using candlestick patterns, traders often fall into predictive traps, which can lead to costly mistakes. A major mistake is to ignore trading volume, as patterns become more reliable when backed by significant volume. Without it, signals may not carry enough weight. Another mistake is to rely solely on a candlestick pattern without confirming it through other technical indicators like the RSI or moving averages. In addition, traders sometimes do not take into account broader market trends or news, which can invalidate signals generated in low-liquidity markets. Misinterpreting patterns across different timeframes is another common problem; for example, a reversal pattern on a 5-minute chart may not align with trends on a daily chart. Avoiding these mistakes requires comprehensive analysis and contextual awareness.
Tips for beginners
Getting started with candlestick patterns can be overwhelming, but taking a structured approach makes it manageable. Start by practicing on a demo account, which allows you to experiment without risking real money. This builds both confidence and skill in analyzing patterns. Incorporating other technical tools such as Bollinger Bands or MACD along with candlestick patterns can enhance your decision-making abilities. It is important to stay informed about market trends and global news to adapt to changing conditions. Finally, focus on mastering a few basic patterns in the beginning and gradually increase your exposure as you gain more experience. This step-by-step learning process ensures steady progress and minimizes confusion.
FAQs
1. Which is the most reliable candlestick pattern for beginners?
The hammer and bullish engulfing patterns are great for beginners due to their simplicity and reliability.
2. Can candlestick patterns predict market reversals?
Yes, several patterns such as the Morning Star or Evening Star are specifically used to identify potential reversals.
3. How can I confirm candlestick patterns before trading?
Use additional indicators such as volume, RSI or moving averages to validate the pattern.
4. Are candlestick patterns useful in cryptocurrency trading?
Yes, candlestick patterns are highly effective in crypto markets due to their volatility, but they should be used with caution given the fast-paced nature of these markets.
The Bottom Line
Candlestick patterns, whether bullish or bearish, are indispensable tools for traders. By understanding their nuances and using them with modern tools, you can make more informed trading decisions. Remember, the important thing is to stay updated, practice regularly and always confirm signals before acting. With the right approach, candlestick patterns can significantly enhance your trading strategy.
Pingback: Hammer Candlestick -
Pingback: Mastering the Evening Star Candlestick Pattern for Reversal Trades - hwealthhub.com