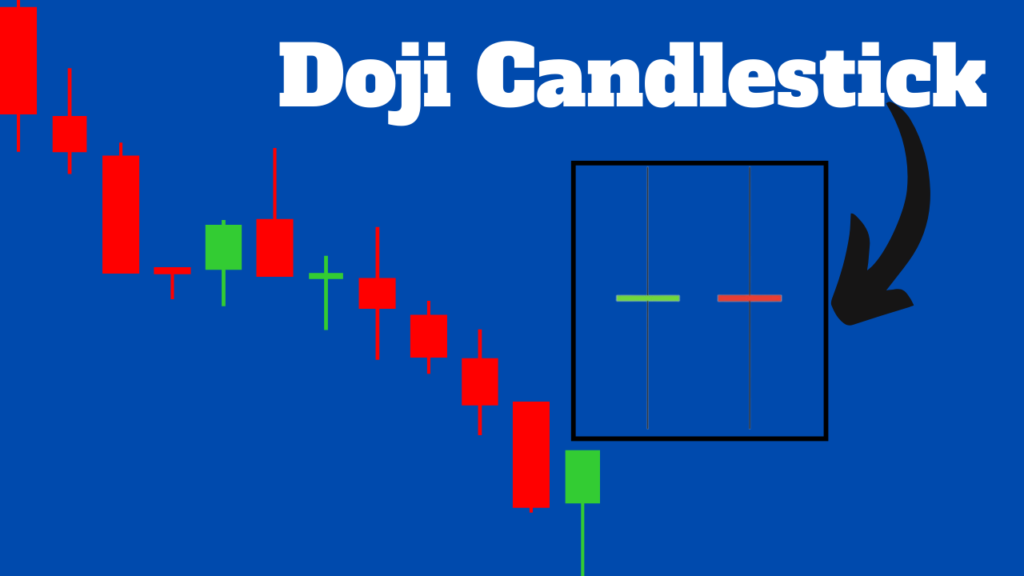
The doji candle is one of the most recognizable patterns in technical analysis. It appears when the open and close prices of a security are nearly identical, resulting in a unique candle shape on the chart. Traders use this pattern to predict potential price behavior. Doji candlesticks can take various forms, such as crosses, inverted crosses, or plus signs. This pattern indicates indecision in the market, where neither buyers nor sellers can control the price movement.
Although the doji candlestick pattern is rare, its appearance is often considered a trend reversal signal, especially when seen in clusters. However, it can also indicate indecision in the market or a pause before the next big move. The meaning of a doji candle varies depending on its context in the market. Traders often look for doji candlesticks during periods of consolidation, where a breakout may soon occur.
Understanding Doji Candles
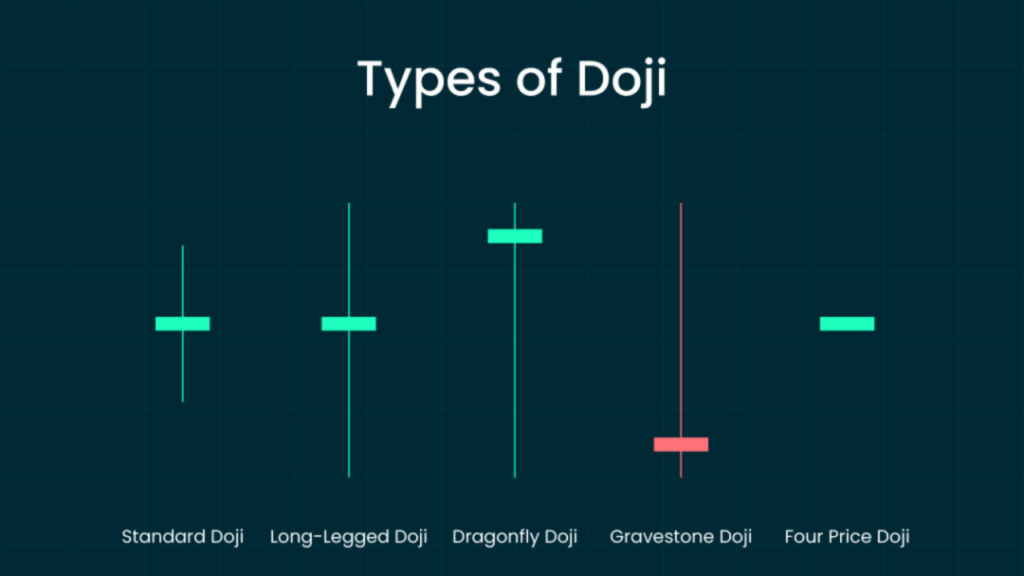
The term “doji” (どうじ/同事) is derived from the Japanese word for “same thing.” The name refers to the rarity of a candle where the opening and closing prices are nearly identical. Doji candles can be classified into several forms, including the gravestone doji, dragonfly doji, and long-legged doji, each of which provides traders with a unique signal about potential market trends. Traders use doji candlestick patterns as an essential tool for predicting price behavior. These patterns are based on four key price points: open, close, high, and low. The candlestick itself is made up of a body (the difference between the open and close) and shadows (lines showing the high and low price). Depending on the formation, the candle can indicate different market sentiments, such as neutrality, bullish or bearish trends.
Types of Doji Candlestick Patterns
1. Dragonfly Doji
The dragonfly doji is a doji candlestick that signals a potential bullish reversal when it forms at the bottom of a downtrend. It appears when the open, close, and high are almost the same, while the low is much lower, creating a long lower shadow. This pattern indicates that sellers initially pushed the price down, but buyers later managed to push it back up, indicating a potential trend reversal. The dragonfly doji is considered a bullish reversal pattern and is often used by traders to predict upward price movement.
2. Gravestone Doji
The gravestone doji is the opposite of the dragonfly doji and signals a bearish reversal when it forms at the peak of an uptrend. The open, close, and low are close to each other, while the high is much higher, creating a long upper shadow. This pattern indicates that buyers initially pushed the price up, but sellers managed to pull the price back down, indicating a potential change from an uptrend to a downtrend. The Gravestone Doji is often used by traders to predict a bearish trend.
3. Long-Legged Doji
The long-legged doji has long upper and lower shadows, with the open and close prices being nearly identical. This doji candle indicates indecision in the market, as both buyers and sellers exert equal pressure, but no one can establish a clear price direction. Long-legged doji candles suggest that a breakout or trend reversal may be imminent, especially if they appear after a long-running trend. Traders use this pattern to identify a period of consolidation, where a new trend may be ready to emerge.
4. Shuten Doji
The Shuten Doji, also known as Shuten-Doji, is a rare and powerful pattern that can signal a major change in market sentiment. It occurs when there is an extreme price range, but the open and close remain at the same level. The Shuten Doji is particularly useful in identifying trend reversals, as it indicates that market participants are indecisive and are waiting for new information to push prices in one direction or the other.
How to Use Doji Candlestick Patterns to Predict Price Reversals
The appearance of a Doji candlestick often serves as a warning sign to traders that a price reversal may be on the horizon. For example, a Gravestone Doji after an uptrend signals that bearish pressure is getting stronger, and the price may decline. Similarly, a Dragonfly Doji after a downtrend signals that bullish momentum may be dominating, causing the price to rise. It is important to note that doji candlesticks alone are not always reliable. Traders usually combine them with other technical indicators, such as the Relative Strength Index (RSI) or Moving Average Convergence/Divergence (MACD), to confirm the possibility of a trend reversal. In addition, the size and shape of the doji’s tail or wick, as well as the following confirmation candle, can help determine ideal entry and stop-loss points for a trade.
Doji vs. Spinning Top Candlestick Patterns
Both doji candles and spinning tops indicate neutrality in the market, but there are key differences. While the body of a doji is very small, the body of a spinning top is slightly larger, although still indicating that buying and selling pressure is roughly equal. Spinning top candles indicate weakness in the current trend, but not necessarily a reversal. On the other hand, doji candles are often seen as indicators of a reversal, especially when followed by a confirmation candle.
How to Trade Using Doji Candles
When trading with doji candles, it is important to consider the broader market context. A doji candle alone may not provide enough information to make a trade. However, when combined with other patterns and indicators, it can provide valuable insight into potential price movements. For example, a dragonfly doji near the support level may indicate a potential bullish breakout, while a gravestone doji near the resistance level may indicate a bearish reversal. Traders often use stop-loss orders to manage risk when trading doji candles. For example, the long-legged doji suggests a range-bound market, and placing a stop-loss just beyond the shadow can help minimize risk in such scenarios.
Is a doji bullish or bearish?
The doji formation can be either bullish or bearish, depending on the market context and the type of doji candle that appears. The dragonfly doji is a bullish pattern that signals potential upward momentum, while the gravestone doji is a bearish pattern that signals downward pressure. The long-legged doji and the Schutten doji are neutral patterns, indicating indecision and potential consolidation.
Using the Doji Candlestick Pattern in Cryptocurrency Trading
The doji candlestick pattern is not limited to traditional stocks; it is also widely used in cryptocurrency trading. Cryptocurrencies, like other assets, can experience periods of indecision or trend reversals, making doji candles valuable for predicting price movements. Traders can use doji patterns in conjunction with other technical analysis tools to improve their cryptocurrency trading strategies.
The Bottom Line
The doji candle is a powerful tool in technical analysis that signals indecision and potential price reversals. The doji candlestick pattern can take various forms, including the gravestone doji, dragonfly doji, long-legged doji, and shuten doji, each of which provides unique insights into market sentiment. Understanding the meaning and interpretation of doji candlestick patterns can help traders make more informed decisions, but it is important to use them in conjunction with other technical indicators to confirm potential trade setups.